- Tutorials
- Getting Up and Running with mDebug
Getting Up and Running with mDebug
Objective
The objective of this tutorial is to demonstrate how to install the mDebug web utility on a Raspberry Pi in order to perform service discovery against the edge Service Mesh.
Take the hands-on lesson for this tutorial
Take the hands-on lesson for this tutorial
All the content presented in this tutorial is available in our hands-on interactive learning environment which you can access here or by clicking on the figure below.
Intended Readers
The intended reader of this document is a person with programming or system administration skills who wants to use the mDebug web utility in order to perform service discovery against the edge Service Mesh.
What You'll Be Doing
During the course of this tutorial you will be installing mDebug web utility from the command line of a Raspberry Pi device and then use it to do discovery against the edge Service Mesh. Thus, you will do the following tasks:
- Get the
.tarfile the represents the mDebug microservice from the mimik repository on GitHub - Verify that a valid Access Token is associated with your running instance of the edgeEngine Runtime
- Deploy the edge Image for the mDebug microservice using the
mimik-edge-clitool - Create and configure the file
start.jsonthat's required to deploy the mDebug microservice - Deploy the edge Container for the mDebug microservice sing the
mimik-edge-clitool - Open the mDebug web page in a browser on the Raspberry Pi desktop
- Do discovery of the Network cluster using the mDebug web utility
Technical Prerequisites
- A Raspberry Pi or another Linux computer running a web browser
- The Raspberry Pi must be running an instance of the edgeEngine Runtime. To learn how to setup a Raspberry Pi device with the edgeEngine Runtime, read the tutorial, Installing edgeEngine and the mimik-edge-cli Tool on a Linux System or MacOS.
- The Raspberry Pi must have an Access Token associated with the edgeEngine Runtime. To learn how create and associate the an Access Token with the edgeEngine Runtime, read the tutorial, Using the mimik-edge-cli Tool to Get An Access Token.
Working with mDebug
The mDebug web utility ships as a standalone edge microservice that runs under the edgeEngine Runtime. As such, you will need to deploy it as you would any other edge microservice. The following steps will show you how to get mDebug up and running.

|
|---|
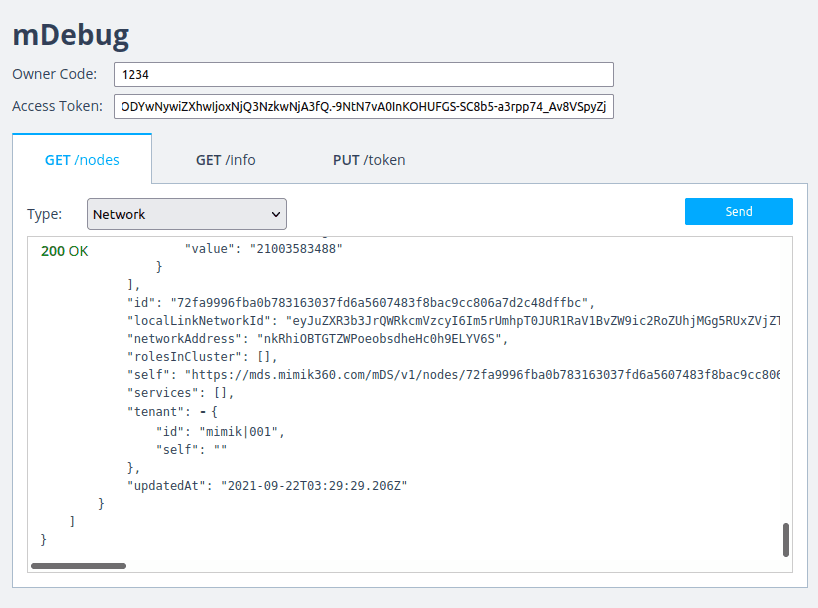
| Figure 4: The mDebug web utility provides a GUI to do discovery on the edge Service Mesh |
Getting mDebug up and running
First you'll need to download the .tar which is the artifact that has the mDebug microservice. The .tar file is known as an edge Image. You'll deploy that image. Then, once the edge Image is deployed, you'll create a running instance of the mDebug microservice by deploying it as an edge Container against the deployed edge Image.
| BE ADVISED: You need to have an Access Token configured to the edgeEngine Runtime |
|---|
|The process of deploying an edge Image and an edge Container requires that you have a valid Access Token configured to the edgeEngine Runtime. If you need a refresher about to get and use an Access Token, Using the mimik-edge-cli Tool to Get An Access Token. The tutorial explains how to get an Access Token using the mimik-edge-cli tool.
To install the mDebug web utility and get it up and running, take the following steps:
Step 1: Download the latest version of mDebug.
You can find the latest version of mDebug on GitHub website at: https://github.com/edgeMicroservice/mDebug/releases.
Clicking the link of the latest version on the mDebug releases page on GitHub will download the file automatically.
Or, if you want to download a specific version from a terminal window, type the following at the command prompt:
curl -OL https://github.com/edgeMicroservice/mDebug/releases/download/1.2.0/mdebug-v1-1.2.0.tar
The command shown above downloads mdebug-v1-1.2.0 to the directory where the curl command is executed.
Step 2: Verify that the edgeEngine Runtime is running on the Raspberry Pi and that an Access Token as been associated on Raspberry Pi. Execute following command to do the verifcation.
mimik-edge-cli account get-me
If successful, you'll get output similar to the following:
1: accountId: 28143048051926016002: linkLocalIp: 192.168.86.393: name: mypi-014: nodeId: a95c7f6035b7d00c12fdf359a7a00f41ac803a521f313f39c5fb17af5: supernodeTypeName: _mk-v15-4996e4c2442cc796f2c0ddb4e5e1627d._tcp6: version: v2.3.1 v2.3.1
Notice in the output above the the key accountId at Line 1 has a value assigned to it. This means that an Access Token is in force. If accountId does NOT have a value, an Access Token is NOT in force. In this case, you will need to create an Access Token and associate it. Read to tutorial, Using the mimik-edge-cli Tool to Get An Access Token to learn how to create and associate an Access Token.
Step 3: Navigate to the directory into which you downloaded the mDebug .tar file.
Step 4: Deploy the mDebug Image by executing the following command in a terminal window
mimik-edge-cli image deploy --image=mdebug-v1-1.2.0.tar --token=`<YOUR_ACCESS_TOKEN>`
WHERE <YOUR_ACCESS_TOKEN> is the value of the Access Token special to your Raspberry Pi device.
Upon success you'll get output similar to the following:
digest: sha265:e45990024b2461577d00f8de60935e5e9ee03fac2859b04e1d714c45cfd1df78id: bb6fba7d-6321-41c5-ac37-1a7a8a9a4ac0-mdebug-v1name: mdebug-v1repoTags:- mdebug-v1:1.2.0size: 131929status: successfully deployed
Step 4: Create a file named, start.json in the directory in which the mDebug .tar file is stored. Insert the the text shown below into the start.json file. This JSON file has configuration information that the mDebug container will use.
{"name": "mdebug-v1","image": "mdebug-v1","env": {"MCM.BASE_API_PATH": "/mdebug-v1/v1","ownerCode": "1234"}}
Step 5: Deploy the mDebug container by executing the following command in a terminal window on the Raspberry Pi device.
mimik-edge-cli container deploy -p start.json --token=<YOUR_ACCESS_TOKEN>
WHERE: <YOUR_ACCESS_TOKEN> is the value of the Access Token special to your Raspberry Pi device.
You'll get output similar to the following:
1: clientId: bb6fba7d-6321-41c5-ac37-1a7a8a9a4ac02: created: 16344876964703: env:4: MCM.BASE_API_PATH: /bb6fba7d-6321-41c5-ac37-1a7a8a9a4ac0/mdebug-v1/v15: MCM.DB_ENCRYPTION_SUPPORT: false6: MCM.LINKLOCAL_REPLAY_NONCE_SUPPORT: false7: MCM.WEBSOCKET_SUPPORT: false8: ownerCode: 12349: id: bb6fba7d-6321-41c5-ac37-1a7a8a9a4ac0-mdebug-v110: image: mdebug-v111: imageId: bb6fba7d-6321-41c5-ac37-1a7a8a9a4ac0-mdebug-v112: name: mdebug-v113: state: started
Pay attention to the value for MCM.BASE_API_PATH as shown in the listing above at Line 4. (Your value for MCM.BASE_API_PATH will be different.) You'll append the MCM.BASE_API_PATH value to the URL http://localhost:8083 that you'll use to view the mDebug web page in your web browser.
You are now ready to bring up the mDebug utility in a browser on your Raspberry Pi device.
Viewing the mDebug UI
To view the mDebug web utility, open the web browser on the Raspberry Pi device and enter a URL similar to the one shown below
http://localhost:8083/bb6fba7d-6321-41c5-ac37-1a7a8a9a4ac0/mdebug-v1/v1/gui
BE ADVISED: The URL you enter will follow the pattern:
http://localhost:8083/ <MCM.BASE_API_PATH> /gui
The <MCM.BASE_API_PATH> for your machine will be the one that you was created when you deployed the mDebug container as demonstrated earlier.
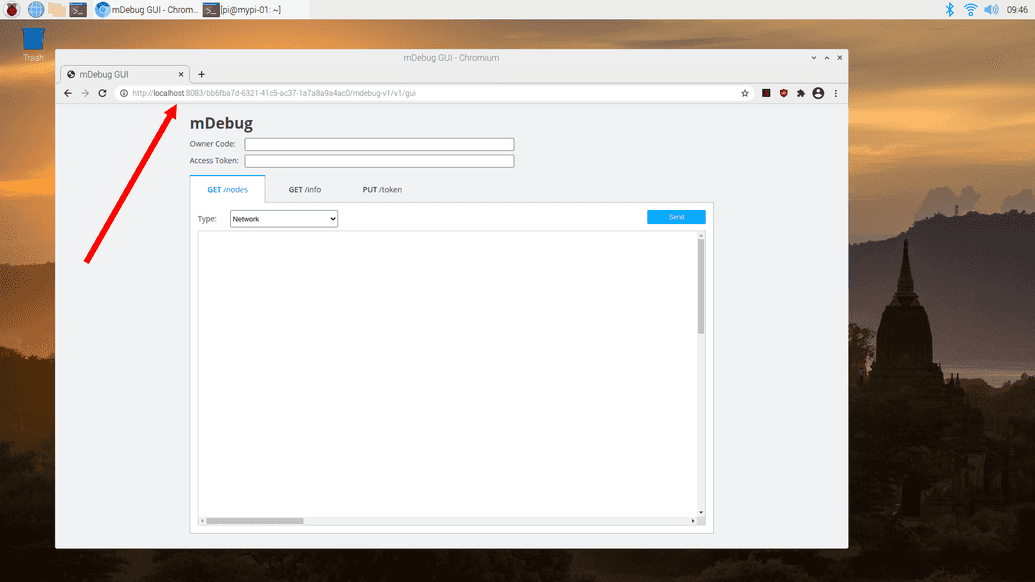
Figure 5 shown below illustrates a Raspberry Pi web browser displaying the mDebug web page. Notice the pattern of the URL in the address bar. The address conforms to the URL pattern described previously.

|
|---|
| Figure 5: The mDebug web utility running on a Raspberry Pi device |
Using mDebug to discover nodes in a Network cluster
Once you have mDebug running in a web browser you can use it to get information relavant to the Raspberry Pi device on which mDebug is running. Also, you can get information about the various clusters that are supported by the edge Service Mesh.
(For an overview of the edge Service Mesh and cluster types, read the key concept, Understanding the edgeEngine Service Mesh.)
In this tutorial we're going to discover all the nodes, including your node, in the Network cluster. To do the discovery execute the following steps.
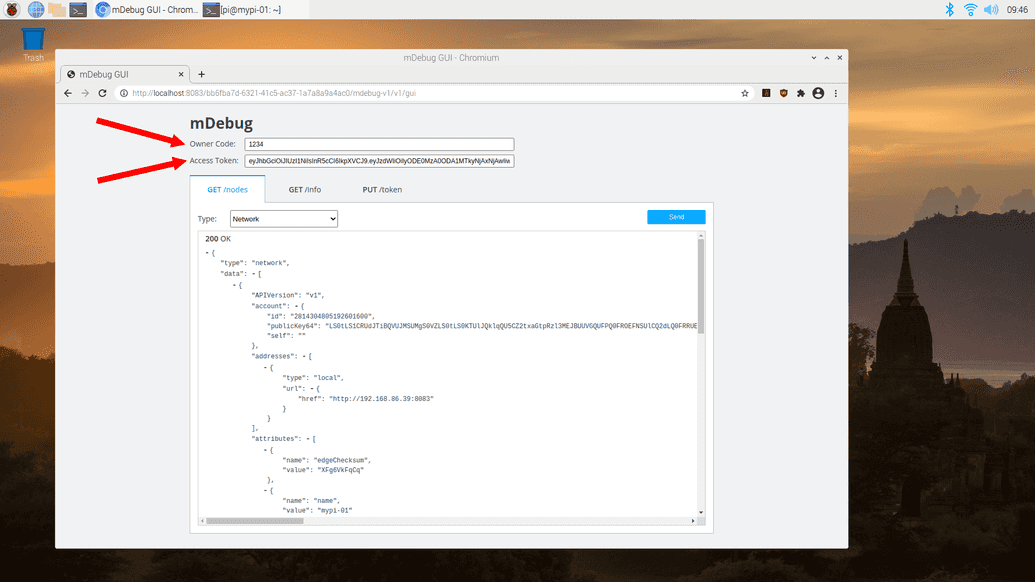
Step 1: Enter the ownerCode that was defined above in the file, start.json into the Owner Code text box as shown below in Figure 6.

|
|---|
| Figure 6: mDebug reporting all the nodes on a Network cluster |
Step 2: In the Access Token text box of the mDebug web page, enter the Access Token you created and used with the mimik-edge-cli tool to deploy the mDebug image and container. (An example is shown above in Figure 6.)
Step 3: Click the Send button at the right of the mDebug web page. Clicking the button will display information about the nodes in the Network cluster.
Congratulations! You've installed, started and viewed the mDebug web utility.
Review
In this tutorial you learned how to get the mDebug web utility up and running in web browser running on a Raspberry Pi device.
- You got the
.tarfile the represents the mDebug microservice from the mimik repository on GitHub - You verified that a valid Access Token was associated with your running instance of the edgeEngine Runtime
- You created and configured the file
start.jsonthat's required to deploy the mDebug microservice - You deployed the edge Image for the mDebug microservice using the
mimik-edge-clitool - You deployed the edge Container for the mDebug microservice sing the
mimik-edge-clitool - You started up the mDebug web utility in a browser on the Raspberry Pi desktop
- You discovered information about of the Network cluster by using the mDebug web utility
